← The Current · November 12, 2026 · How solar works · 3 min read
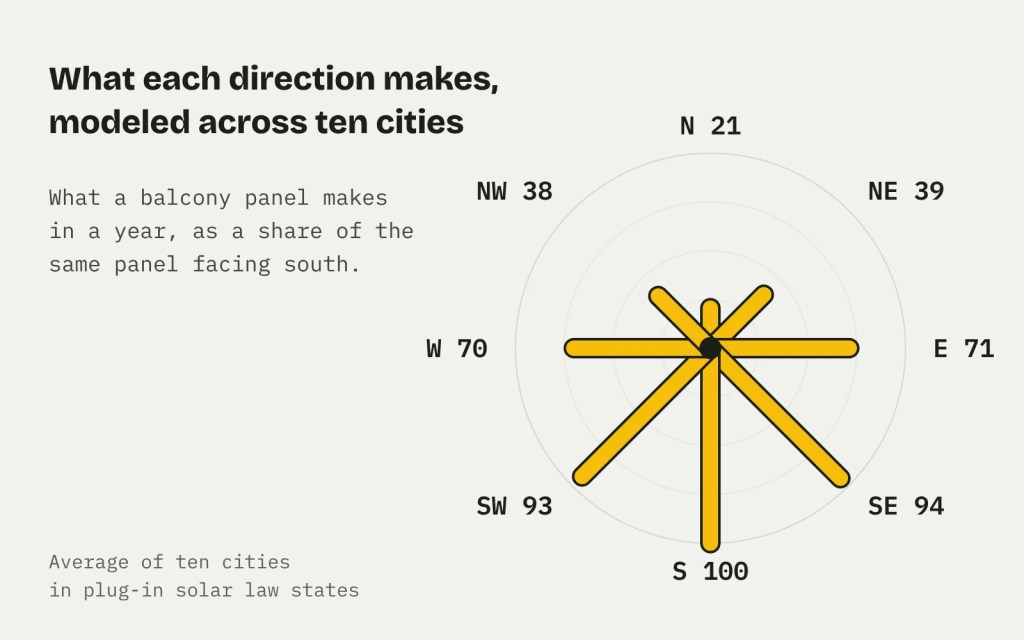
Renters don’t get to pick which way their balcony points, so what you need to know is how much the direction you’re stuck with costs you. We modeled a railing panel facing all eight compass points in ten cities. Southeast and southwest give up only about 6 or 7 percent compared with due south!
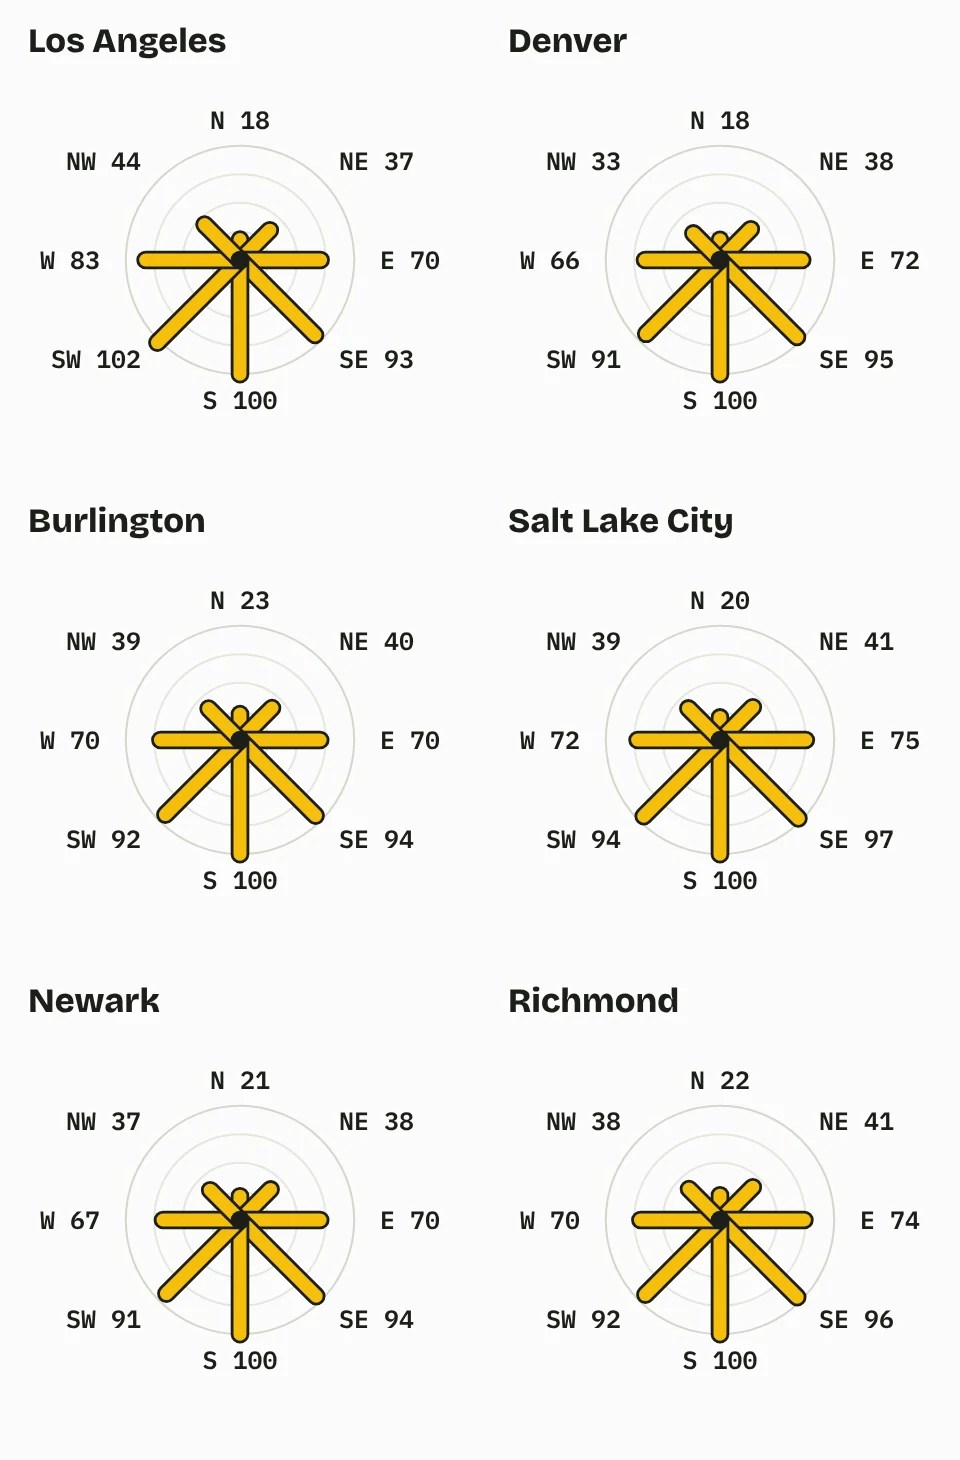
The short version. Averaged over ten cities, a vertical panel facing southeast makes 94 percent of what a south-facing one makes, southwest 93, east 71, west 70, northeast 39, northwest 38 and north 21. Two cities break the pattern: in Los Angeles southwest edges past south and west beats east by 17 percent, and in Denver west falls about 9 percent short of east.
How to check which way your balcony faces
Stand a step back from the railing facing out, with your back to the building, and open your phone’s compass. Turn on true north in its settings if you can, since metal railings and magnetic north can both throw off the reading. Anything from southeast to southwest is a strong spot.
| City | S kWh | SE | E | NE | N | NW | W | SW |
|---|---|---|---|---|---|---|---|---|
| Burlington | 340 | 94 | 70 | 40 | 23 | 39 | 70 | 92 |
| Portland, ME | 374 | 92 | 67 | 36 | 20 | 36 | 67 | 92 |
| Hartford | 363 | 94 | 71 | 39 | 21 | 38 | 69 | 92 |
| Manchester | 370 | 94 | 70 | 38 | 21 | 36 | 68 | 91 |
| Newark | 370 | 94 | 70 | 38 | 21 | 37 | 67 | 91 |
| Salt Lake City | 401 | 97 | 75 | 41 | 20 | 39 | 72 | 94 |
| Baltimore | 369 | 95 | 73 | 40 | 22 | 38 | 69 | 92 |
| Denver | 446 | 95 | 72 | 38 | 18 | 33 | 66 | 91 |
| Richmond | 377 | 96 | 74 | 41 | 22 | 38 | 70 | 92 |
| Los Angeles | 410 | 93 | 70 | 37 | 18 | 44 | 83 | 102 |
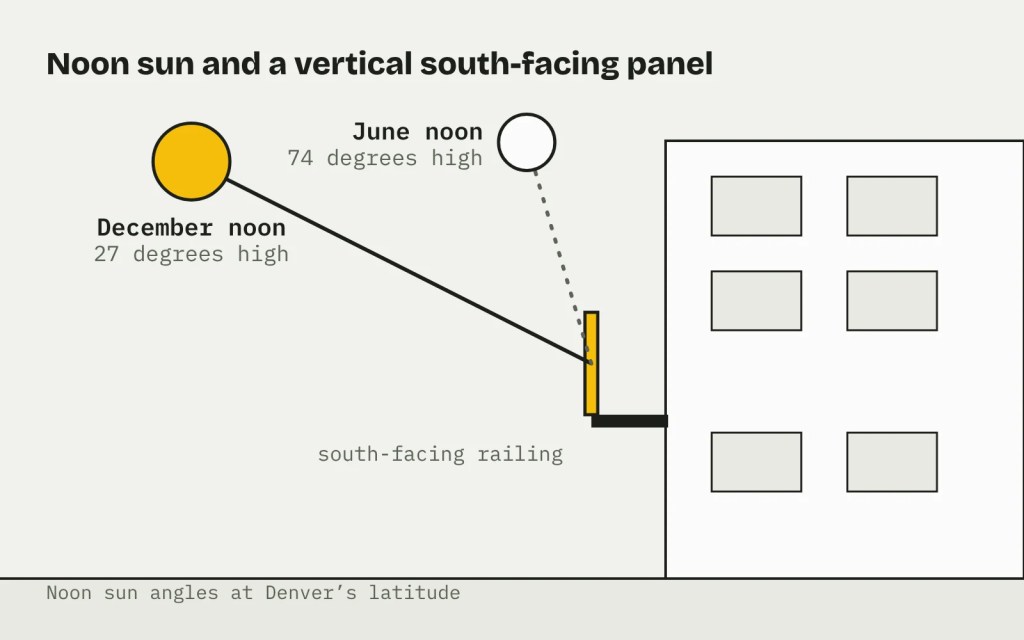
Those are percentages of a south-facing panel in the same city. South-facing railings also do better in December than June, which we covered in a separate post. The Solarly Advisor takes your address and direction and gives you a number for your home.
East or west depends on where you live
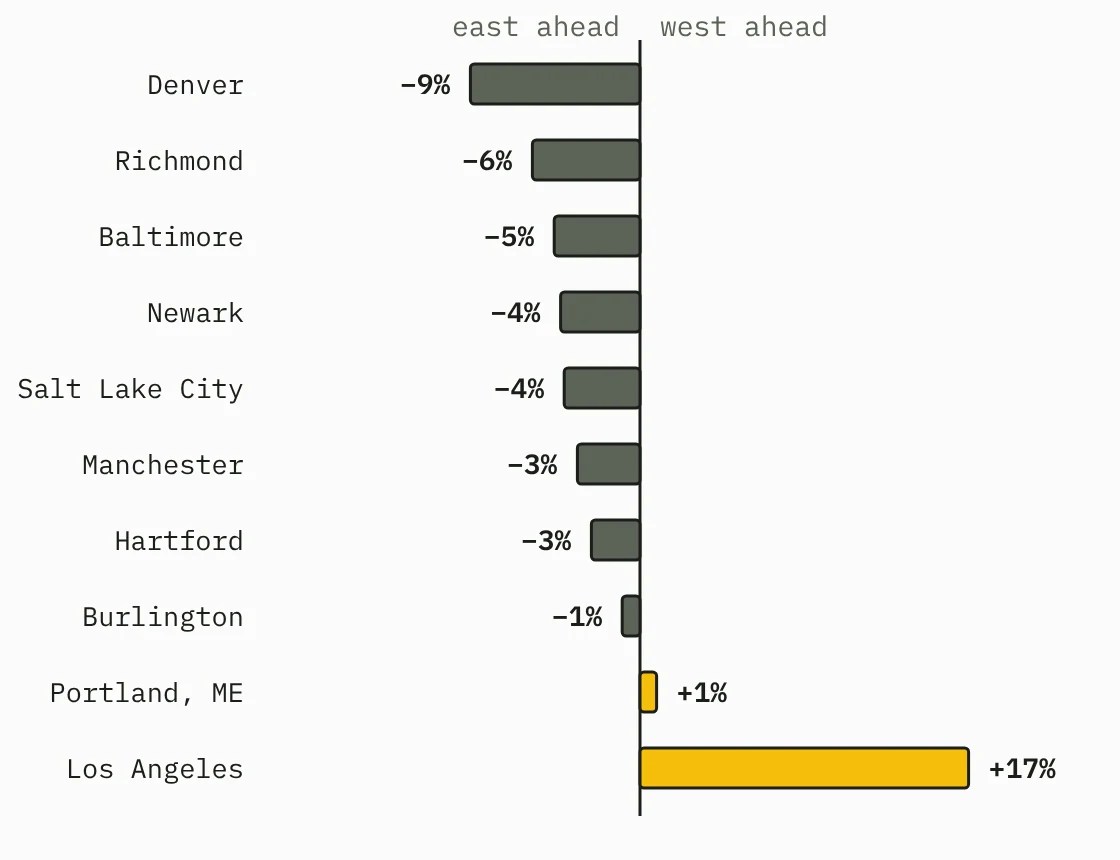
Eight of the ten cities lean east, mostly by a few percent, and Burlington and Portland, Maine, are effectively ties. East makes slightly more in most of these cities, though west can be worth more if your air conditioning runs in the late afternoon. The two big gaps go in opposite directions, and local weather offers a likely reason. In Colorado, summer thunderstorms tend to build in the afternoon, and in Southern California the marine layer often keeps May and June mornings gray before it clears. West falls furthest behind in Denver from June through August, and west pulls furthest ahead in Los Angeles in May and June, when those patterns are strongest. PVWatts shows the same direction in both cities, though it puts the Los Angeles gap at 13 percent.
North-facing balconies make very little
A vertical north-facing panel made 73 to 82 kilowatt-hours a year in our model, about a fifth of what south does, and northeast and northwest came in at 33 to 44 percent. We’d hold off on a kit for a north-facing balcony unless there’s another sunny spot you’re allowed to use, such as a yard or a shared roof.
How we ran this. PVGIS 5.2 from the European Commission’s Joint Research Centre with its NSRDB solar dataset, for a 400-watt crystalline panel hung vertically with 14 percent system losses, using NSRDB weather years 2005 to 2015 with terrain horizon on, in Burlington, Portland (Maine), Hartford, Manchester, Newark, Salt Lake City, Baltimore, Denver, Richmond and Los Angeles. Modeled figures don’t include shade from nearby buildings. Checked November 9, 2026.
By Ben van der Veen. Solarly is independent and reader-supported.


Leave a Reply